Table of Contents
ToggleThe Zonda Global (peviously BitBay) exchange is currently the largest and probably the best European cryptocurrency exchange. It was established in 2014 s one of the first in Europe. Currently it has almost 1 million users (the most popular stock exchange in the UK) and the number is constantly growing. The majority of users of this platform are British, but among the users there are citizens from all over EU, Asia and the US. This platform for trading and exchanging digital currencies was founded by Sylwester Suszek in 2014 in Poland. It has a different owner and President now. Current registration data are BB Trade Estonia OÜ, with headquater and licences in Estonia. You can register right now free account at Zonda exchange. Click below:
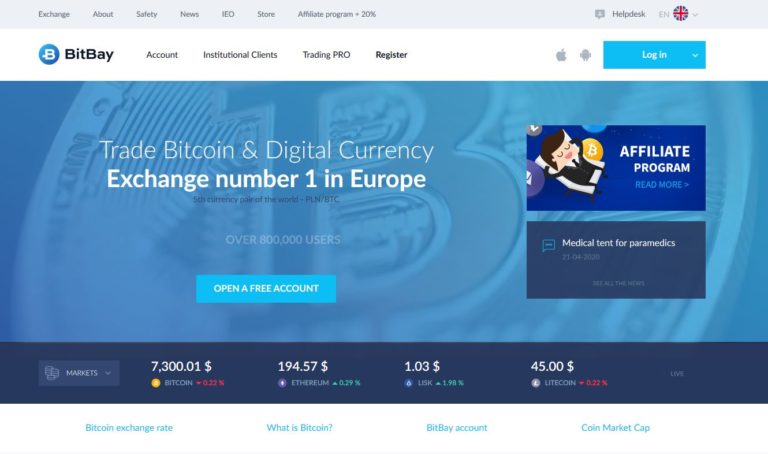
For European users, it has the advantage of having many language versions of the website and it is supported in several languages. Currently this cryptocurrency exchange is available in 8 languages (in addition to English and German, users can also use Chinese, Russian, Portuguese, Spanish, French and Polish).
On Zonda (BitBay) exchange buying cryptocurrencies is possible in four traditional currencies (dollar, euro and British pound). This is important because many other exchanges do not give the opportunity to buy cryptocurrencies for traditional currencies. It allow you only to exchange one cryptocurrency for another. Zonda Global is also one of the best cryptocurrency exchanges in Europe.
Zonda Global (previously BitBay) has gained the trust of customers, it gives a lot of possibilities and the number of cryptocurrencies offered to buy. It stands out definitely in terms of ease of use. Security methods (2 levels) are also a strong point, thanks to which it enjoys unwavering user trust. It is also worth considering the fact that this cryptocurrency exchange provides so-called API plugin that allows external programs to connect and trade on the stock exchange without logging in. If You want to see possibilities in Binance cryptocurrency exchange You can learn everything from this page.
If You want You can register right now at Zonda exchange. Click the button below:
Secure redirection
The platform is constantly developing and introducing new solutions and new cryptocurrencies, e.g. Stellar (XLM) or Monero (XMR). In June 2018 it moved its activities to Malta, than in 2019 to Estonia, where it operates to this day. The same year management of this cryptocurrency exchange introduced further interesting digital currencies, e.g. OmiseGO, Golem, Zcash, as well as Agur (REP), Basic Attention Token (BAT) and 0x (ZRX) and TenX or PAY. So it’s not only a place where you can buy ethereum or litecoin but also many other digital currencies.
Zonda Global put a lot of work into mechanisms enabling users to submit tax returns in accordance with applicable regulations.
The Zonda Global (prev. BitBay) exchange requires sending documents confirming users’ personal data and thoroughly verifying them, therefore, at the beginning you should be patient. Fast sending of the required documents in the right form significantly accelerates the time needed by the exchange staff to verify your account.
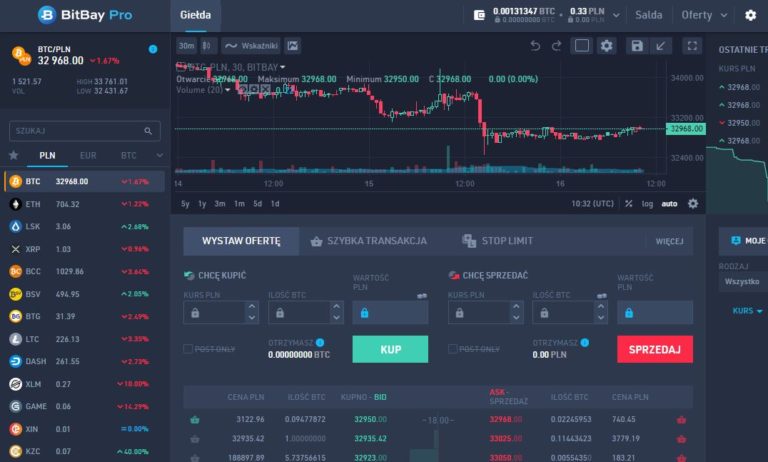
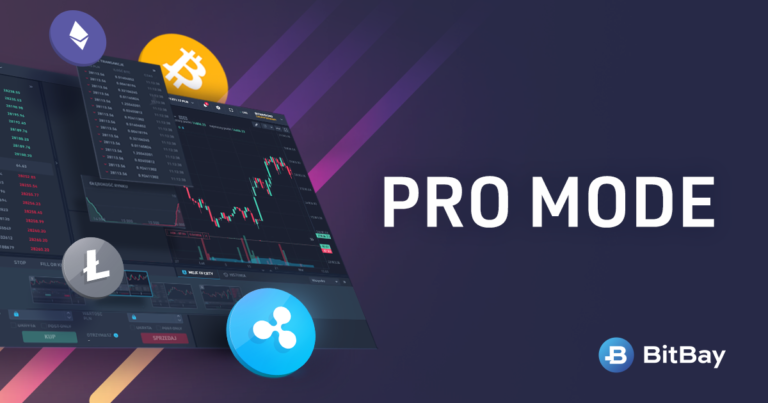
Zonda exchange provides two types of chart views. One basic is available in the main user panel. The second, more professional and with differently arranged data is available under the “Zonda PRO” tab.
The chart allows the use of most of the most important tools for detailed technical analysis. Both basic solutions such as for advanced traders and analysts:
Selecting. a cross, a dot, as well as an eraser and an arrow.
Determining the market structure. horizontal line, trend lines, trend angle, vertical line, horizontal radius, radius, extension, opening angle, etc.
Analyzes through price and time methods or time-price. Forks, as well as other forks, e.g. rigid forks, internal, Fibonacci time, trend-based fib extension. Pitchfan, gann box, gann square, Fibonacci correction, fib speed resistance fan. Time according to the Fibonacci trend, Fibonacci vertebrae, spiral and Fibonacci wedge.
Measuring tools. Short and long position, date and price range. Forecast, date and price range, projection and ghost feed,
Market geometry – from the most famous ones such as: ABCD formation, XABCD pattern, head and shoulders, cypher pattern. Triangle pattern, three drives pattern, Elliott pulse wave (12345) and other Elliot waves e.g. ABC corrections.
Earning on the cryptocurrency market does not necessarily have to apply only to trade. Many people do not know technical analysis and do not have enough nerves or time to keep track of charts and make the right transactions.
We encourage such people to familiarize themselves with the affiliate program proposed by the European Zonda cryptocurrency exchange (prev. BitBay)
Register your account on Zonda by clicking here or through any of the buttons available on this page.
You will get a unique reference link or reference links if you have a need for more.
Promote the stock market in different ways – here everything depends on how you do it.
You can publish valuable materials on Youtube, Facebook or, for example, create ebooks or write articles or create a website like this.
You earn money on the turnover of people who have registered through your link. If you have a lot of friends who have funds for investments, you might want to start by talking to them?
The basic commission is 20% of the value charged by the exchange commission for transactions. However, it can grow depending on the number of people registered through your link.
You will reach 25% after obtaining 1,000 people. Whereas 30% after exceeding the 2000 threshold.
Sounds interesting? Register today and start making money on the trading of other people!

Zonda (previously BitBay) is a platform that is often the first step for people who want to invest in the cryptocurrency market. Mainly because it is the largest such platform, available entirely in English. English and originally targeted exclusively at the English market. The portal supports deposits and withdrawals of fiduciary currencies – Euro, Dollars and GBP. The exchange user has access to 33 different cryptocurrencies and the ability to trade on 85 cryptocurrency and currency-cryptocurrency pairs.
The Zonda Global commission system is mixed – partly regressive, partly permanent. For crypto-crypto pairs, the maker commission is 0%, while taker 0.1%. For pairs related to fiduciary currency on one side, the commission is calculated regressively, depending on the client’s turnover. In this case, the taker is from 0.43% to 0.25% and the maker from 0.30% to 0.17%. Payout commissions for cryptocurrencies depend on the given coin. For BTC it is currently $ 3.90, and for other tokens – on average $ 0.48. Withdrawing fiat currency is associated with other costs. The cost of a SEPA transfer is 0.1% of the amount paid, and the cost of a SWIFT transfer is 0.25% of the amount paid.
Investing in cryptocurrency projects is extremely risky. Due to the anonymity of this technology, it is susceptible to various scams, thefts and use for illegal purposes. Among other things, for this reason, cryptocurrency exchanges are the targets of an attack, because the funds derived are very difficult to track. From this perspective, the European Zonda exchange (previously BitBay) is very lucky that they have not had such a slip-up so far. We keep our fingers crossed that this never happens.
Therefore, do not treat our article in the category of investment advice in any case, but only a signpost. We wish you good investment decisions and invite you to read other articles. We assume no liability for the activities of the Zonda Global (BitBay exchange). We are not in any way connected with them personally or by capital, we only cooperate in partnership recommending their services.
It is a cryptocurrency exchange, that allows you to buy and exchange electronic currencies in dozens of different pairs.
Yes. Anyone wishing to be able to trade cryptocurrencies must have a verified account. If you do not want to trade, but only see the appearance of the account then it may be without verification.
Yes. We do not charge any fees for account maintenance. The fees are charged on the transactions performed and they are described in the table of fees and commissions.
Just go to zondaglobal.com and fill out the registration form. It takes less than 5 minutes.
The owner of the Zonda cryptocurrency exchange is BB Trade Estonia OÜ
You can earn money trading cryptocurrencies. Also, by inviting friends to use and actively promoting Zonda (BitBay) through reference links. The cryptocurrency exchange has a fair and transparent Affiliate Program. Anyone with a verified account can participate in it.
The company running the Zonda exchange is registered in Estonia.
As you can see, this cryptocurrency exchange offers a very good opportunity to invest money in virtual encrypted coins. These can be, for example, US dollars, euros or pounds sterling. In addition, this platform is constantly developing and adding more languages and tokens and cryptocurrencies.